The Infection Fatality Rate varies significantly by location, the population, age and available medical services. This study uses the CDC data, the Census data, estimated infection fatality rates, and a spread sheet to reveal some interesting things about the Pandemic.
| Age Group | IFR (%) | Chance of survival (%) |
Population by Age Group |
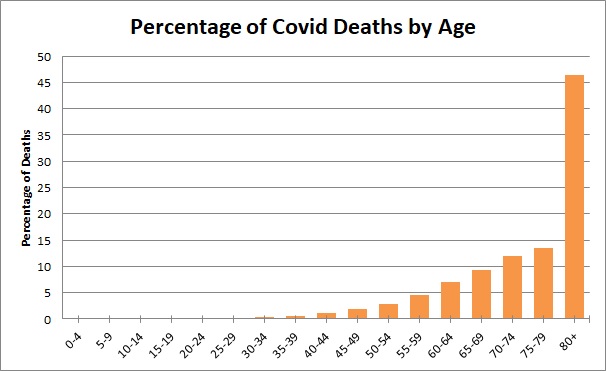
Covid Deaths | Number of People Who have been Infected | % of Population infected | Percentage of Covid Deaths |
| 0-4 | 0.003 | 99.997 | 19,458,000 | 67 | 2,233,333 | 11.5 | 0.016 |
| 5-9 | 0.001 | 99.999 | 20,430,000 | 27 | 2700,,000 | 13.2 | 0.006 |
| 10-14 | 0.001 | 99.999 | 21,827,000 | 40 | 4,000,000 | 18.3 | 0.009 |
| 15-19 | 0.003 | 99.997 | 21,628,000 | 150 | 5,000,000 | 23.1 | 0.036 |
| 20-24 | 0.006 | 99.994 | 21,537,000 | 452 | 7,533,333 | 35.0 | 0.107 |
| 25-29 | 0.013 | 99.987 | 22,964,000 | 932 | 7,169,231 | 31.2 | 0.221 |
| 30-34 | 0.024 | 99.976 | 22,902,000 | 1,748 | 7,283,333 | 31.8 | 0.415 |
| 35-39 | 0.04 | 99.96 | 22,292,000 | 2,691 | 6,727,500 | 30.2 | 0.639 |
| 40-44 | 0.075 | 99.925 | 20,643,000 | 4,365 | 5,820,000 | 28.2 | 1.036 |
| 45-49 | 0.121 | 99.879 | 20,510,000 | 7,509 | 6,205,785 | 30.3 | 1.783 |
| 50-54 | 0.207 | 99.793 | 20,846,000 | 11,925 | 5,760,870 | 27.6 | 2.831 |
| 55-59 | 0.323 | 99.677 | 22,187,000 | 19,289 | 5,971,827 | 26.9 | 4.579 |
| 60-64 | 0.456 | 99.544 | 21,072,000 | 29,821 | 6,539,693 | 31.0 | 7.079 |
| 65-69 | 1.075 | 98.925 | 17,962,000 | 39,264 | 3,652,465 | 20.3 | 9.321 |
| 70-74 | 1.674 | 98.326 | 14,493,000 | 50,633 | 3,024,671 | 20.9 | 12.020 |
| 75-79 | 3.203 | 96.797 | 9,643,000 | 56,701 | 1,770,247 | 18.4 | 13.460 |
| 80+ | 8.292 | 91.708 | 12,205,000 | 195,640 | 2,359,383 | 19.3 | 46.442 |
| 99.087 | 332,599,000 | 421,254 | 8,3751,671 | 25.2 | 100.000 | ||
| Average | Total 2020 | Current | Current | Overall |
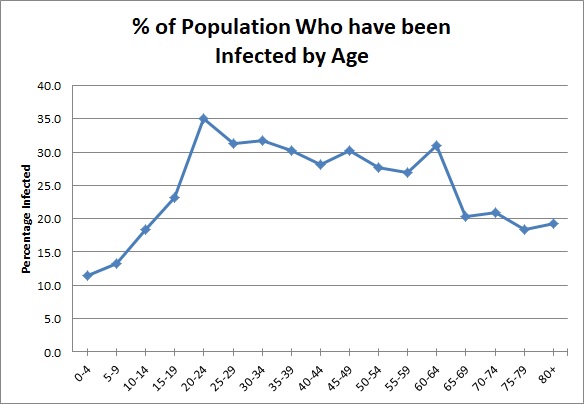
1) 25% of the American population has already contracted
Covid-19. Specific age groups have different percentages. About 30% of
Americans 20-64 have already contracted Covid-19. We are nearly half
way to Herd Immunity, but lockdowns, social distancing, and mask
mandates have slowed the process, but have slowed the death rate as well.
Perhaps vaccinations will get us there sooner.
The Number of People who have been Infected=Covid Deaths/(IFR%/100)
% of Population infected=(Number of People Infected/Population by
Age)x100 Blue in Table
2) Overall there is a better than 99% chance of survival if
infected by Covid-19, but this percentage varies by age. For those
under 50 there is a better than 99.9% chance of survival.
(100-IFR%)
Pink in Table
3) 88% of all Covid-19 deaths are of people over 60 year of
age.
(46.44+13.46+12.02+9.321+7.079)
Orange in Table
4) College, high school, and grammar school aged children have
a higher chance of dying of the flu than from Covid-19. The teachers
should be vaccinated and the schools should be opened immediately.
https://www.statista.com/statistics/1127799/influenza-us-mortality-rate-by-age-group/
Limitations: The number of significant figures of the IFR limits the accuracy of the individual values derived from it, namely, the Number of People who have been Infected and % of Population Infected; however, these inaccuracies do not affect the conclusions drawn above.
References:
https://www.acsh.org/news/2020/11/18/covid-infection-fatality-rates-sex-and-age-15163
https://www.who.int/bulletin/volumes/99/1/20-265892/en/
https://www.medrxiv.org/content/10.1101/2020.05.13.20101253v3
https://onlinelibrary.wiley.com/doi/10.1111/eci.13423
https://www.cdc.gov/coronavirus/2019-ncov/hcp/planning-scenarios.html