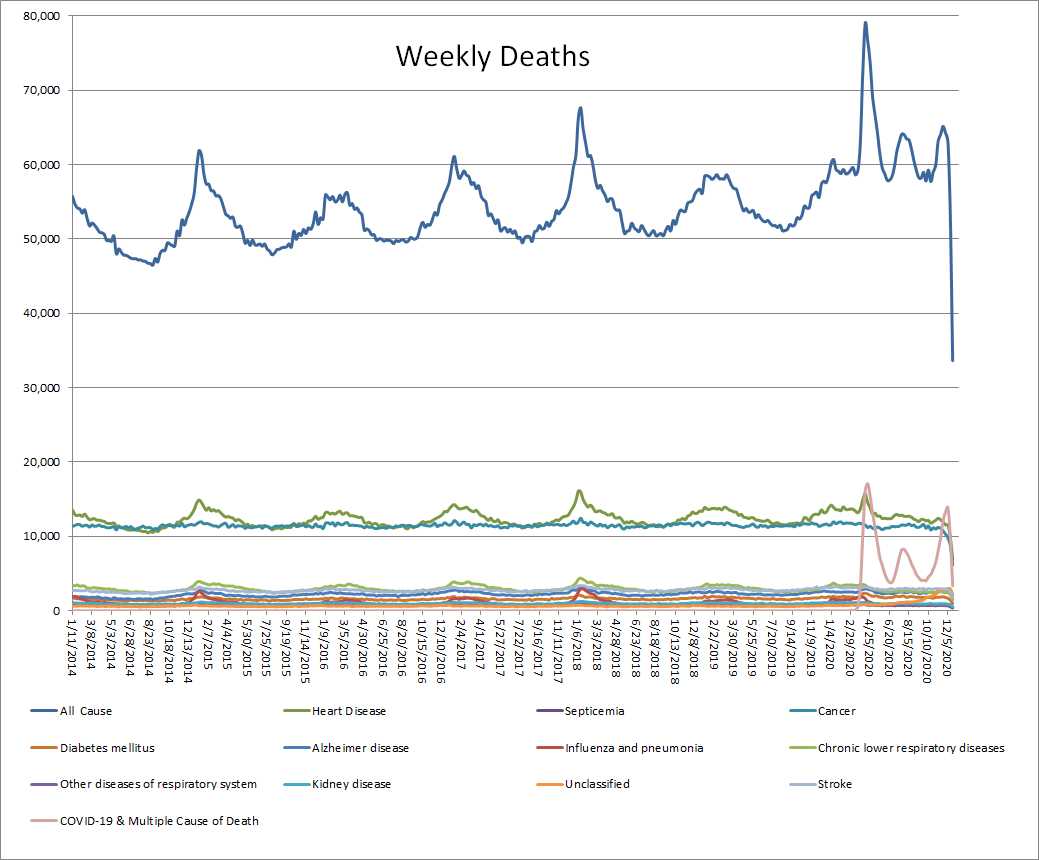
This first graph shows that a decrease in deaths from all causes has
taken a dramatic plunge during the "third wave" of
the pandemic. The third wave is not greater than the first wave and is
merely an increase expected due to the change in weather and the
beginning of a new flu season. Note the seasonal variations of death from all causes.
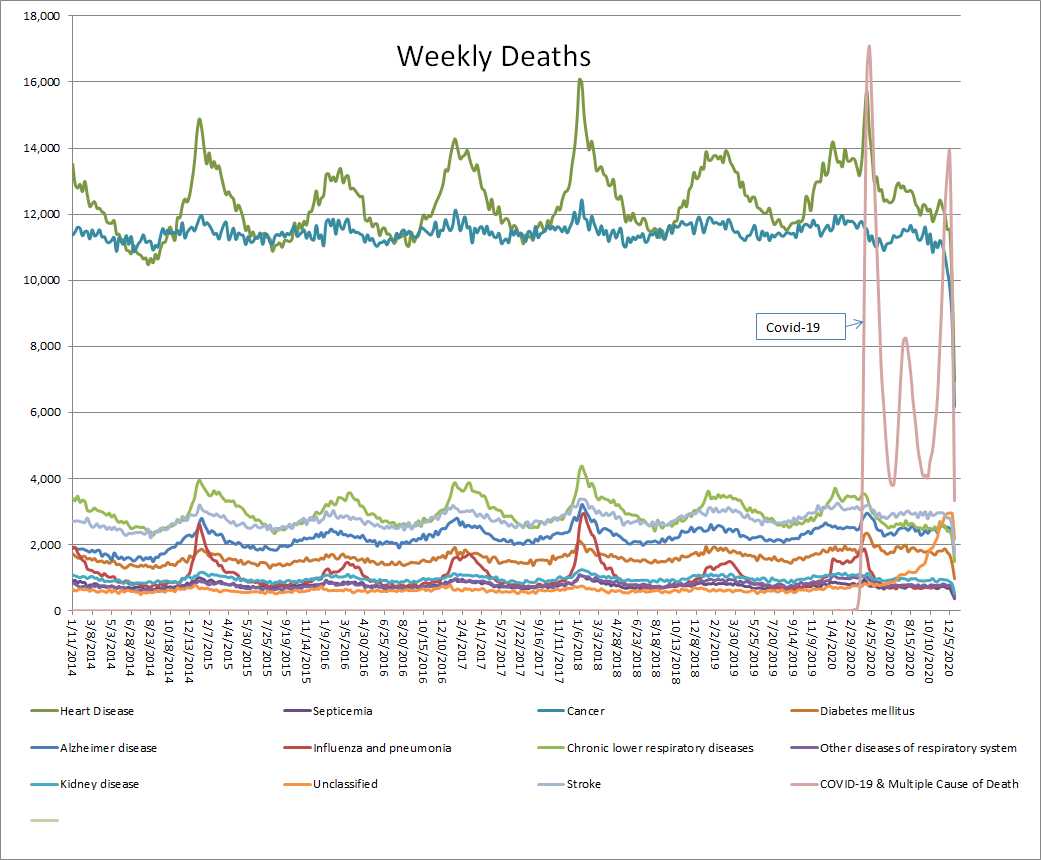
The second graph shows how Covid-19 weekly deaths has briefly increased above heart disease and cancer. Note the seasonal variations of death for heart disease and cancer.
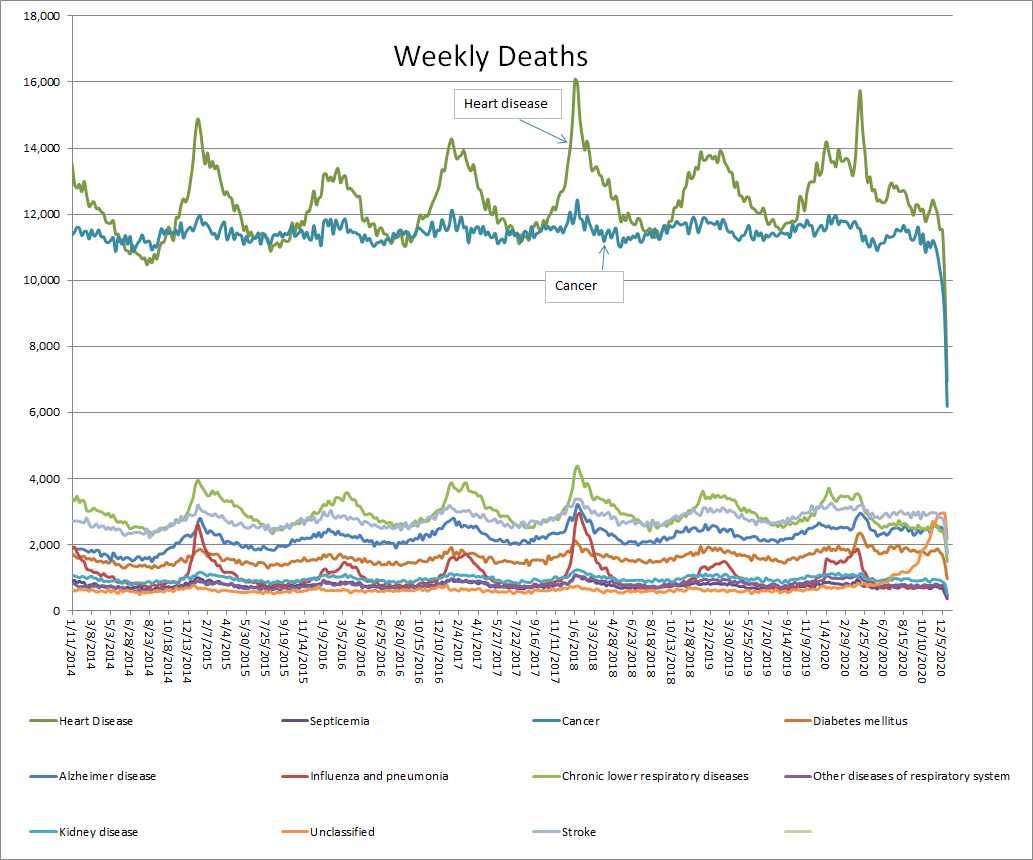
Removing Covid-19 reveals both heart disease and cancer deaths have dramatically decreased during the third wave.
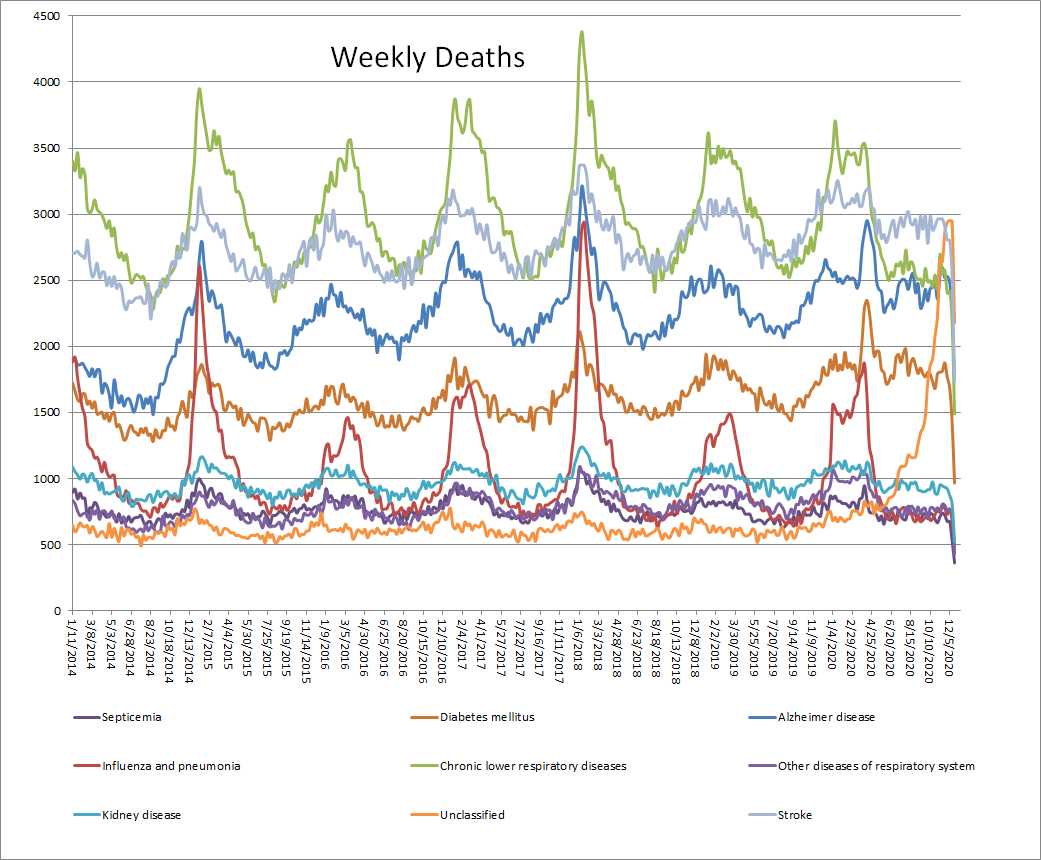
Removing heart disease and cancer reveals the seasonal variation in
death from all other causes and a dramatic decrease in weekly deaths
from all other diseases. How is it possible for all causes of death to
decrease while Covid-19 deaths increase? Conclusion: Covid usually
prevents all other causes of death.
So what is really going on? The seasonal flu is seasonal and pushes
people who are ill with ANY disease over the edge and is the cause of the
seasonal variation in death from ALL other causes. This is exactly what
is going on with Covid-19.
These graphs are from the CDC data set for 2014-2018
and 2019-2020. This work was inspired by Dr. Genevieve
Briand: https://www.youtube.com/watch?v=3TKJN61aflI, and as of now the tutorial is still available.